Bull vs. bear case: how to project a stock's price
The short answer
To project a stock's price, you estimate three futures instead of one. A bear case where things go wrong, a base case where they go roughly as expected, and a bull case where they go right. For each, you project revenue, profit margin and earnings per share a few years out, then apply a reasonable valuation multiple.
The result isn't a prediction. It's a range, and the range is the useful part: it shows how much you could lose if you're wrong, how much you could make if you're right, and what has to happen for each.
Why one price target isn't enough
A single number feels precise, but it hides everything that matters. Two stocks can both have a "fair price" 20% above today's price. One has a bear case 10% below today; the other, 60% below. They are not the same bet.
Scenarios fix three problems with one-number targets:
- They show the downside. You see what you stand to lose before you buy, not after.
- They make assumptions visible. Each case is a short story with numbers: growth slows, margins hold, the multiple shrinks.
- They tell you what to watch. If the bull case depends on margins rising to 30%, margins are the number to check every quarter.
Analyst price targets are usually one number. Scenario analysis encourages you to think in ranges instead.
The four inputs behind every projection
A simple earnings-based projection needs four numbers for each case:
- Revenue growth. How fast sales grow each year.
- Profit margin. How much of each sale becomes net income. Together with revenue, this gives earnings.
- Shares outstanding. Divide net income by shares to get earnings per share (EPS). Buybacks shrink the share count; new shares grow it.
- The P/E multiple. What the market might pay for each unit of earnings at the end of the period.
Put together:
Projected price in year N = Starting EPS × (1 + annual EPS growth)^N × P/E in year N
N is the number of years. If you build from revenue and margins instead, calculate each year's EPS as Revenue × Net income margin ÷ Shares outstanding. EPS growth then follows from those assumptions; it is not an extra growth rate to apply on top.
The implied yearly return is:
CAGR = (Projected price ÷ Today's price)^(1 ÷ N) − 1
These are price returns, excluding dividends, fees and taxes. They assume the stated holding period and are not guaranteed investment returns.
The multiple is the input people forget. A company can grow earnings 10% a year and still lose you money if its P/E falls from 35 to 20 along the way.
Building bear, base and bull: a worked example
Example Co (hypothetical) earns $1.30 per share and trades at $30, a P/E of about 23. Here are three five-year stories:
| Case | The story | EPS growth / year | P/E in year 5 | EPS in year 5 | Price in year 5 | Total return | Return / year |
|---|---|---|---|---|---|---|---|
| Bear | Growth stalls, competition squeezes margins, the market loses interest | 2% | 15 | $1.44 | $21.53 | −28.2% | −6.4% |
| Base | Growth roughly matches expectations | 9% | 20 | $2.00 | $40.00 | +33.3% | +5.9% |
| Bull | New products land, margins expand, the market pays up | 15% | 25 | $2.61 | $65.37 | +117.9% | +16.9% |
How to set each case
- Base: start from analyst estimates for the next two or three years, then fade growth toward a sustainable rate. Use a P/E close to the company's long-term average or its peers.
- Bear: ask what a realistic bad outcome looks like, not a catastrophe. Lower growth, slightly lower margins and a lower multiple usually come together. Consider a separate stress case if financial distress or permanent loss is a meaningful risk.
- Bull: the same exercise the other way. Be honest about what has to go right, and keep the multiple within what similar companies have actually traded at.
Example Co is hypothetical; figures computed for illustration. Calculations use unrounded EPS before displaying two decimal places.
A real example: Microsoft in the Projection tab
Foremetrics' Projection tab runs this method with Bear, Base and Bull cases you can edit year by year. The supplied Microsoft (MSFT) screenshot shows a current price of $535.49 and starting EPS of $18.00, with a net margin of 40.3%. The example was captured on 6 November 2026.
The figures below reproduce the supplied Projection inputs and outputs. They are a dated model illustration, not independently verified Microsoft financial results or analyst forecasts. The starting column is labelled 2025 in the screenshot; check the underlying fiscal-period data before applying these assumptions to an investment decision.
| Case | Revenue growth / year | Net income growth / year | P/E range | EPS in 2030 | Price range in 2030 | Return / year |
|---|---|---|---|---|---|---|
| Bear | 3% fading to 1% | 2% fading to 0% | 12–16 | $19.49 | $234–$312 | −15.3% to −10.3% |
| Base | 10% fading to 5% | 12% fading to 7% | 18–25 | $28.71 | $517–$718 | −0.7% to +6.0% |
| Bull | 18–20% fading to 12% | 22–25% fading to 18% | 25–35 | $47.82 | $1,195–$1,674 | +17.4% to +25.6% |
Data and starting inputs from the supplied Foremetrics Projection example, 6 November 2026. Each case shows a low and high price from its low and high P/E. Annual returns follow the tab's five-period model convention, not an exact date-to-date holding period from November 2026.
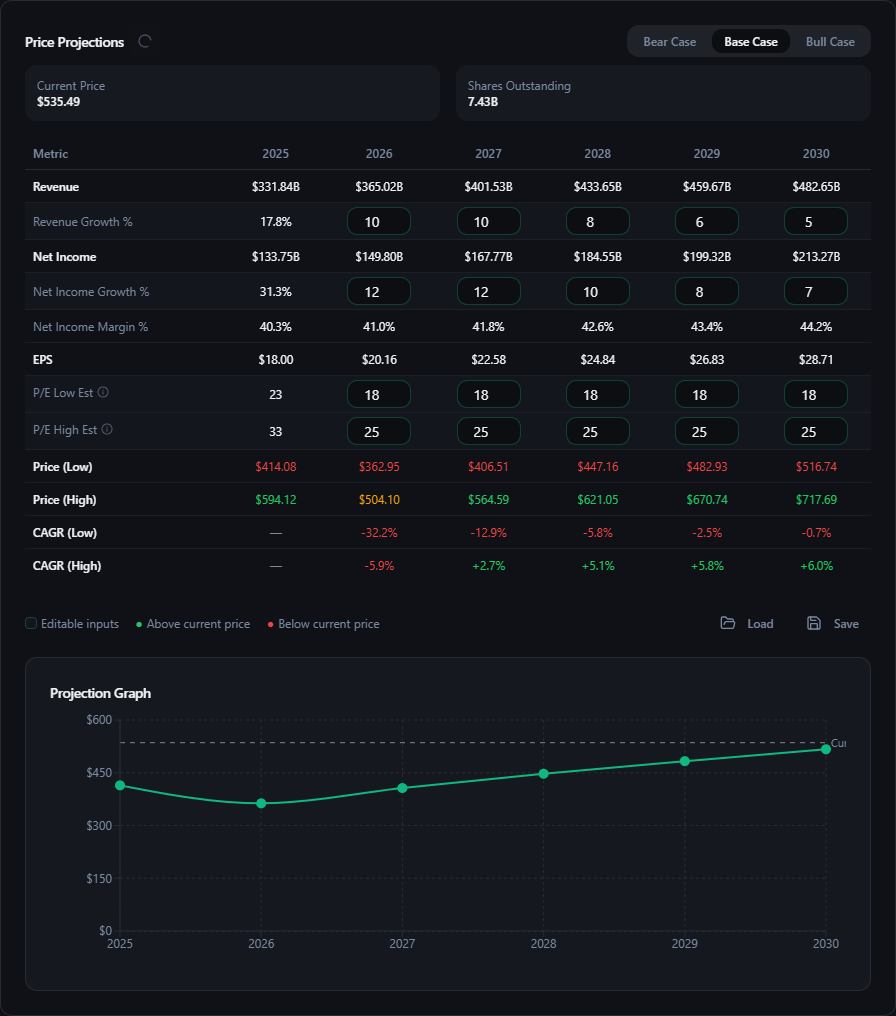
What stands out
- Even the Base Case barely beats the starting price. Earnings grow about 60% across the model, but if the P/E settles at 18–25, down from roughly 30 at the starting price, the yearly return is between −0.7% and +6.0%. Much of the assumed growth is already reflected in the price under this scenario.
- The multiple does most of the damage in the Bear Case. EPS still edges up, but a P/E of 12–16 takes the price down to $234–$312.
- The Bull Case needs a lot to go right: revenue growth near 20% for several years and net margins rising toward 50%.
Those are starting points, not conclusions. The tab is built to be changed: if you think a Bear Case P/E of 12 is too harsh for Microsoft, change it and watch the range move.
How to read the range
- Where does today's price sit? Close to the Bear Case: the market may already be pricing in bad news, but downside is limited only if your assumptions are sufficiently conservative. Close to the Bull Case: a lot has to go right, and disappointment can hurt. A model range is not a floor or ceiling on the actual stock price.
- Compare the downside with the upside. A bear case loss of 30% and bull case gain of 120% is an asymmetric range, but it does not establish the odds. Consider the probabilities, the base case and outcomes outside your model.
- Ask which case you actually believe. Weight them honestly. If you'd give the bear case a 40% chance, don't size the position as if it were 10%.
- Find the swing input. Usually it's one number: growth, margin or the multiple. That's what to watch at every earnings report.
A useful check is to run the same assumptions through a Custom DCF. If the scenario price and DCF fair value are far apart, one of the models may contain an assumption worth questioning. Compare them on the same date basis: an undiscounted future price is not directly comparable to today's DCF fair value. See DCF vs P/E: two ways to value a stock.
Common mistakes
- A bear case that's just "base minus a bit". A real bear case tells a different story: slower growth, weaker margins and a lower multiple, together.
- Keeping today's P/E forever. Fast-growing companies may see their multiple shrink as growth slows. Allow for that possibility unless you have a reason not to.
- Bull cases with no ceiling. Check that the bull revenue is plausible against the size of the company's market.
- Forgetting the share count. Buybacks can raise EPS; dilution from stock-based pay can lower it.
- Projecting too far. Beyond five years, small changes in growth compound into huge differences. Keep the horizon short enough to reason about.
- Setting it and forgetting it. Update the cases after each earnings report, and note which one reality is tracking.
FAQ
What is a bull case and a bear case?
A bull case is an optimistic scenario for a company's future; a bear case is a pessimistic one. Investors use both, with a base case in between, to see the range of possible outcomes.
How far ahead should I project?
Three to five years is common. It's long enough for the business story to play out, and short enough that the assumptions stay grounded.
What P/E should I use for each case?
Anchor it to the company's own history and its peers. A lower multiple in the bear case and a higher one in the bull case is usual. Our guide Forward P/E explained covers how to compare multiples.
Is a price projection the same as a price target?
Not quite. A price target is often an analyst's single number for a stated horizon. A scenario projection shows a range of outcomes under different assumptions, making the risks and trade-offs more visible.
Should I use a projection or a DCF?
Both. A projection based on earnings and a multiple is quick and intuitive; a DCF works from cash flow and is less directly dependent on the market's earnings multiple. Both depend heavily on assumptions. See How to build a DCF valuation step by step.
Build your own bear, base and bull
Pick a stock you own. Open its Projection tab in Foremetrics, check the Bear Case first, and change any input you disagree with. If you can live with the bear case, you have a clearer view of the risk you're modelling—not a guarantee against a worse outcome.
Start your 14-day free trial — full access, no credit card required.
Projected prices are model estimates based on the assumptions shown, not forecasts or price targets, and not a recommendation to buy, sell or hold any security. Microsoft example figures are from the supplied 6 November 2026 model snapshot and will change. Not financial advice. For informational and educational purposes only.